Bitcoin Report - March 2024
Posted on 02/04/2024 | 392 Views
Today our Independent Research Analyst, Isaac Ho from the Ainslie Research Team, brings you the latest monthly deep dive specifically on Bitcoin – including market analysis, on-chain metrics, sentiment, and technical analysis. He highlights some of the key charts that were discussed and analysed by our expert panel in the latest Beyond the Block episode, but also expands upon his work with some additional insights. We encourage you to watch the video of the original presentation if you haven’t already.
Bitcoin Market Analysis/on-chain
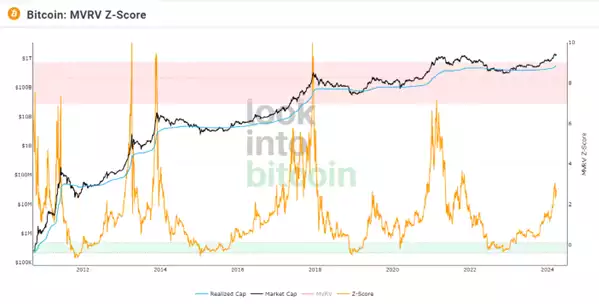
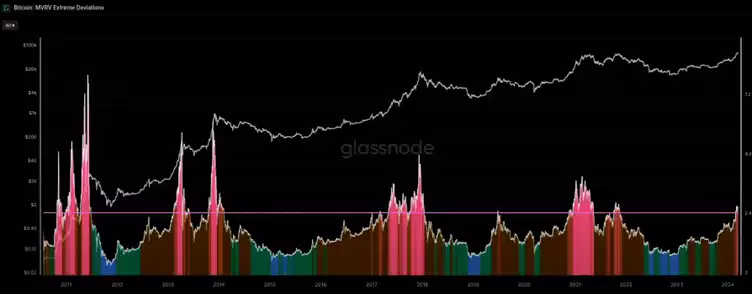
The MVRV Z-Score is a measurement of Bitcoin's current price relative to its fair value. This metric measures the deviation between market price and realised price (Bitcoin Realised Price is the value of all bitcoins at the price they were last transacted on-chain, divided by the number of bitcoins in circulation). It is useful at indicating prices where Bitcoin may be considered overbought or undervalued. Historically, the MVRV Z-Score has proven very effective as a macro signal for market tops and bottoms. A score of 0 (no deviation between realised price and market price) or a slightly negative score indicates holders are in losses indicating discounted prices where investors may want to accumulate.
It's important to note that as Bitcoin adoption grows and supply becomes more widely distributed, realised price generally increases. This leads to a diminished volatility, translating to lower MVRV Z-score peaks over time – an evident trend across past cycles.
Bitcoin’s past price action post halving have shown multiple months of consolidation or lowering prices. If price action plays out similarly this time, the current MVRV Z-score of 3 is anticipated to decrease somewhat, before picking up again for the final phase. Given the diminished volatility, I anticipate a Bitcoin market ‘top’ to occur when MVRV Z-score reaches the 5-6 range.
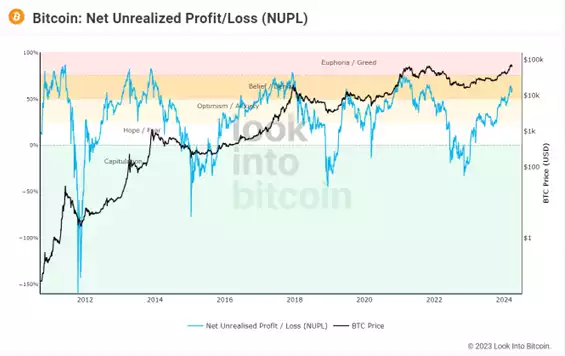
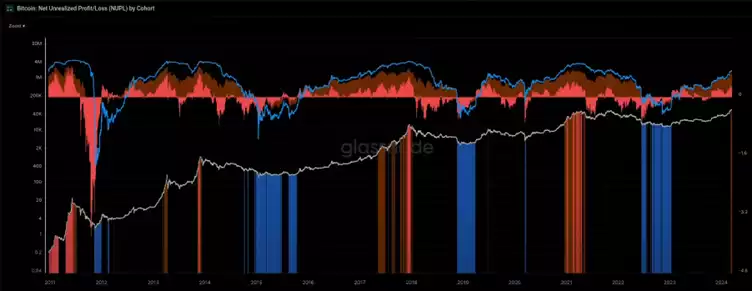
The NUPL chart shows the Net Unrealised Profit/Loss. This chart reveals whether most Bitcoin holders are currently in profit or loss. Since we are in a phase where many holders have unrealised profits, currently the NUPL suggests that we are in an overheated market that could be nearing a temporary peak. Price consolidation can also reset the NUPL giving it time to recharge for and another run up. It is important to note that these conditions can persist for some time, often lasting around 6 months to 1 year as seen by the orange bands. Like the MVRV chart, the NUPL has demonstrated its accuracy in identifying fair value zones to allocate into.
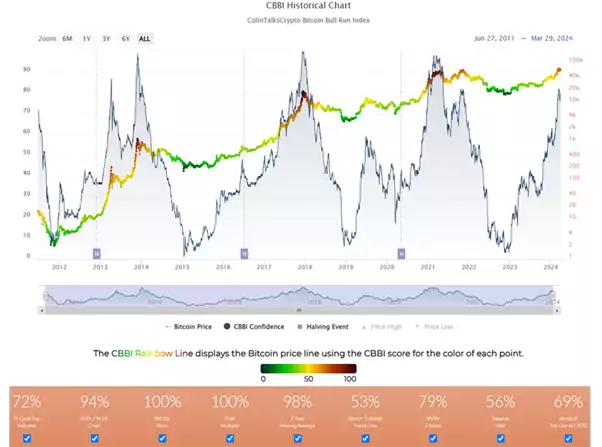
The following metric is a conglomertion of 9 different cycle indicators. The score is currently elevated at 80 suggesting a potential period of a pullback or consolidation - post halving price action malaise as per previous cycles.
However, there are some differences this time given that Bitcoin’s price has exceeded its past all time high, thus breaking the 4 year cycle model. There are some calling for a left translated cycle at play this run. If so, then we could see an accelerated appreciation in Bitcoin’s price for the remainder of the year. This could could move the CBBI score to 95 – 99 region suggesting most of the 9 indicators are at the extremes - signalling a topping phase has begun, indicated by the dark red/brown dots. However, we do not currently believe that any topping phase is near, given that the halving is yet to occur.
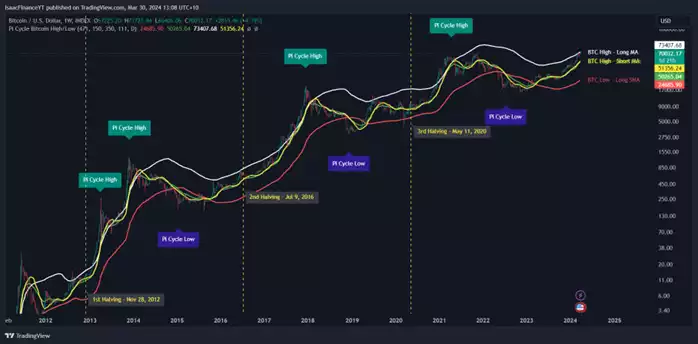
The Pi Cycle Indicator, though slightly lagging, clearly shows market tops occurring when the green and yellow short-term moving averages (MAs) cross the white long-term MA. The current position aligns perfectly with a typical pre-halving phase, reinforcing the expectation of a standard 4-year cycle. However, as mentioned previously, the previous all-time high has already been broken pre-halving - an historical first. This creates both potential advantages and risks. If price consolidates and establishes a new base here, it could form a foundation for an even stronger, sustained move upwards. This would raise Bitcoin's realised price and establish a higher fair value. Conversely, a euphoric surge without consolidation, creating the left-translated cycle, could result in reaching a peak much faster, followed by a lengthier drawdown with a prolonged bear market. If we are gifted with the price action of a ‘normal’ 4-year cycle we would expect the price to range between 52k-73k, although this is looking less likely with the strength in Bitcoin’s price action currently.
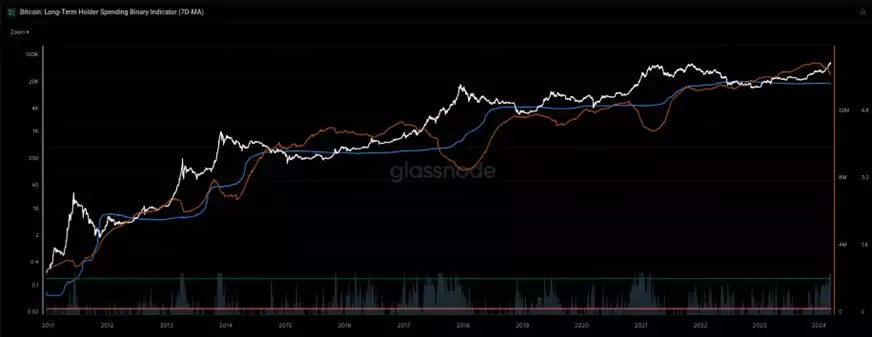
Long term holders are beginning to distribute their holdings after Bitcoin reached the previous all-time high. This is expected behaviour as savvy investors take profits near liquidity zones, often found at new all-time highs. While not a definitive top signal, this activity suggests a shift in market sentiment. Historically, the most euphoric price surges coincide with long-term holder distribution. As a result, the bias is moving away from 'buy every dip' and towards heightened awareness for possible top signals throughout the second half of 2024 and into mid to late 2025.
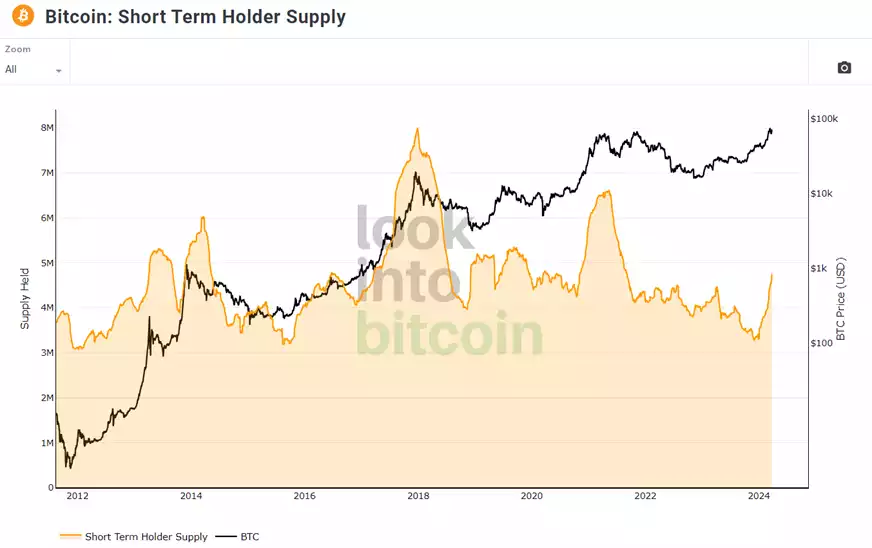
Short term holders are switching hands with long term holders as seen in the short-term holder supply chart. Further following the narrative that we are approaching the euphoric phase of the market in the coming months as switching hands is typically indicative of heightened volatility as the market moves towards more short-term speculation.
Market Sentiment
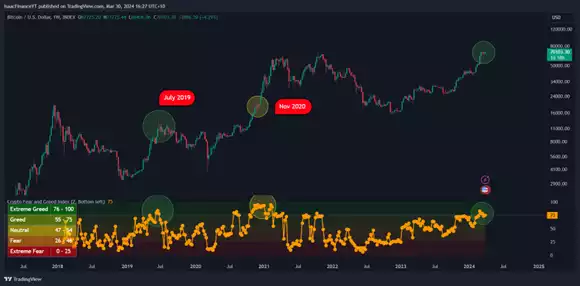
Currently market sentiment suggests over extension. Looking very similar to both the 2019 and 2020 peaks in the fear and greed index, notably upon reaching over extension in sentiment there is typically either a draw down or consolidation momentarily before another rise in price. In a bull market, the index can remain in the ‘greedy’ section for a very long time and if positions were offloaded the moment the lower range of extreme greed was hit you would have missed out on significant subsequent price increases. Market sentiment should be used as a biasing tool, following the famous Warren Buffet quote, “be fearful when others are greedy, and be greedy when others are fearful”. It is clear we are in the ‘greedy’ phase, where we should slowly start being on the lookout for more evidence of topping signs. Even though we are expecting more upwards movement, every significant rise in price from here should be raise your caution. Historically once Bitcoin has hit the lower band of extreme greed, the market peaked approximately 12 months later.
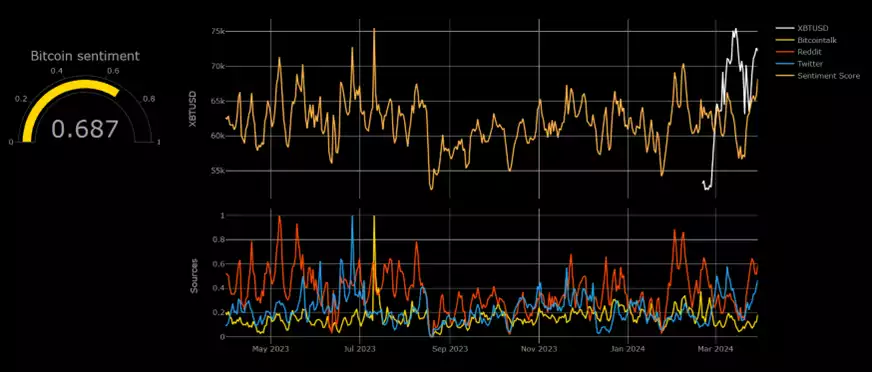
For short term sentiment, this indicator uniquely tracks social media and forums to gauge the emotional pulse of the market – something that broader metrics like the Fear and Greed Index don't fully capture. It excels in revealing the mood of average investors during rapid shifts. For instance, when Bitcoin dropped 17% from its ATH, the sentiment score hit 2/10 (or 20%). This extreme low signalled a subsequent bounce back to baseline on many other occasions. This tool can be highly useful for identifying local bottoms and tops, potentially enhancing entry decisions. A current reading of 68% indicates neutral/bullish sentiment, making it an inadvisable time to enter positions.
Technical Analysis
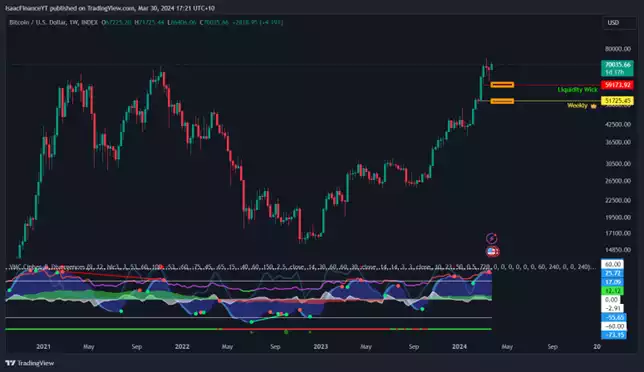
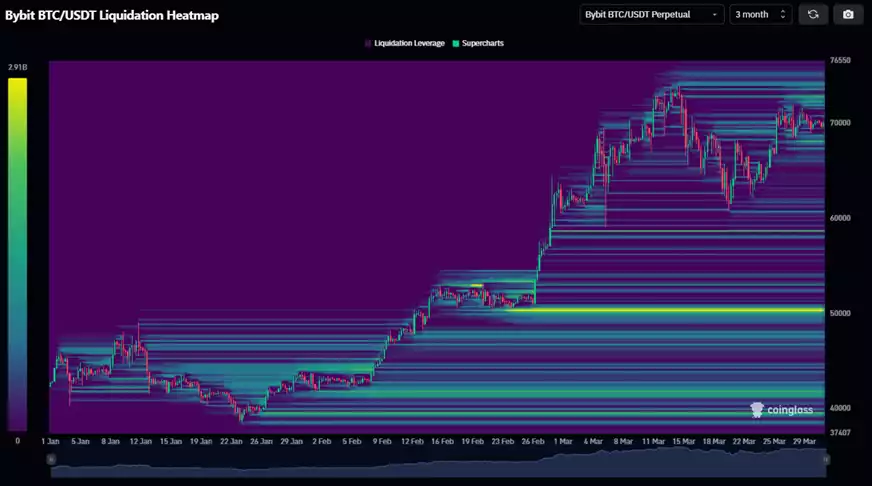
Technically, we're encountering resistance after breaching all-time highs. Momentum and RSI indicators suggest local exhaustion, implying either consolidation or a short-term downtrend. However, the long-term bias remains bullish. If a downtrend occurs, expect strong support around $59,000 – a high-interest liquidity region where many derivative traders will have placed stop-losses. Price action is often drawn to these areas, clearing out liquidity for the next upswing. Should there be see a deeper pullback, look for support between $51,000-$52,000. This level combines high historical volume with a weekly support level.
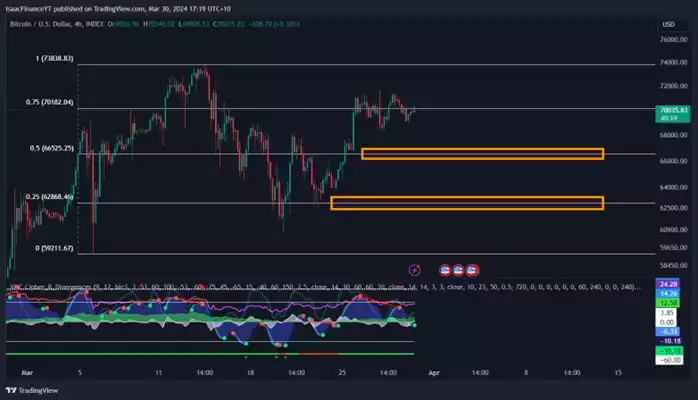
Short-term, we're in a contracting triangle pattern, which typically signals an aggressive breakout in either direction. If we see a drop, I'll watch the orange boxes for local support. These are crucial levels within the channel and high-volume nodes. While these timeframes aren't ideal for trading, it's good to be aware of potential support areas. Regarding resistance, I'm focused on the all-time high. We could see a liquidity swing above it followed by a pullback (a double top formation). However, the next chart suggests this scenario is less likely.
Regarding liquidity regions in the derivatives market, the $59,000 area does show some interest below the wick, though perhaps less than the $51,000 region with its substantial liquidity below the channel. It would require a significant catalyst to push prices that low. I don't currently see a reason for a 26% drop from our current price of $70,278. However, as always in crypto, anything remains possible.
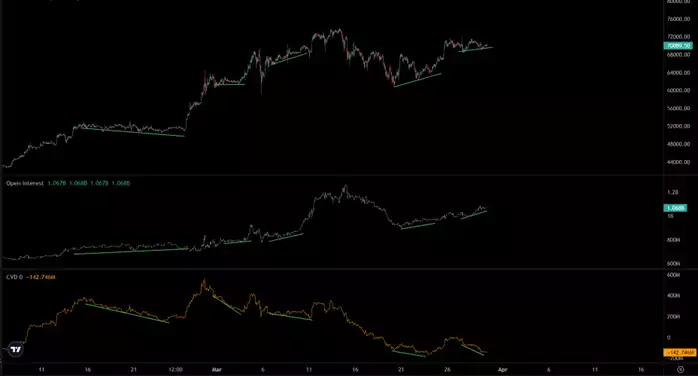
CVD and open interest metrics reveal a slight bullish divergence. While this doesn't guarantee a price increase, it does raise the probability of an upward breakout rather than a downward one – especially on these smaller timeframes. This divergence signals rising or stable price action alongside increasing open interest and decreasing CVD. The implication is that limit buy orders are maintaining price levels, preventing a 1:1 correlation between CVD and price.
Watch the most recent video presentation of Bitcoin Analysis: Beyond the Block where I share some of these explanations in a panel format, and join the discussion on our YouTube Channel here.
I will return with more detailed analysis of everything Bitcoin next month, including more market analysis, on-chain metrics, sentiment, and technical analysis…
Isaac Ho | Independent Research Analyst
The Ainslie Group
x.com/IsaacsDevCorner