Bitcoin Analysis: Beyond the Block - March 2024
Posted on 26/03/2024 | 651 Views
Today the Ainslie Research team (ainslie.to/research) brings you the latest monthly update on Bitcoin – including the Macro fundamentals, market and on-chain technical metrics and all of the other factors currently driving its adoption and price. This summary highlights some of the key charts that were discussed and analysed by our expert panel. We encourage you to watch the video of the presentation in full (https://youtu.be/CtV46YKeRqw) for the detailed explanations.
Btcoin and Global Liquidity
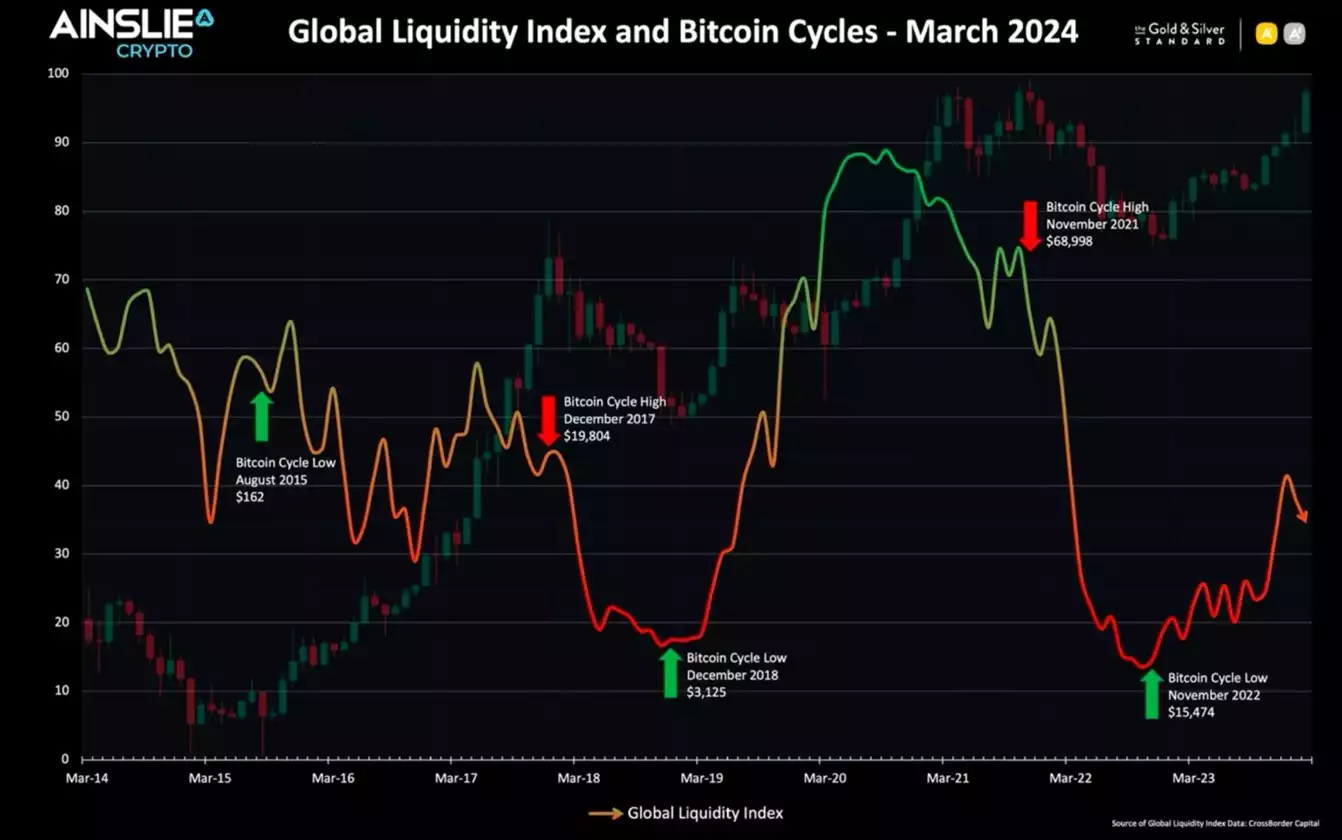
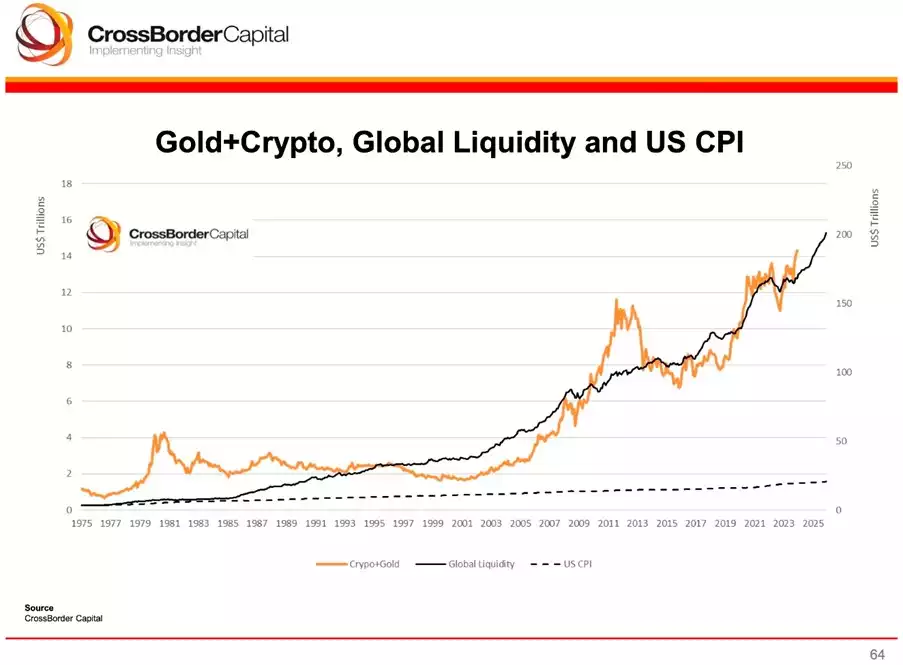
Bitcoin is the most directly correlated asset to Global Liquidity. Trading Bitcoin can be thought of as trading the Global Liquidity Cycle, but with an adoption curve that leads to significantly higher highs and lows each cycle. As such we look to buy Bitcoin during the ‘Bust’ phase or liquidity low, then rotate out of it during ‘Late Cycle’ where liquidity is over extended and downside protection is required (our preference is to rotate into Gold). When correctly timing and structuring the rotation, it is possible to significantly outperform ongoing monetary debasement. The Bitcoin cycle low was in November 2022, and since then the returns have been unmatched by any other major asset.
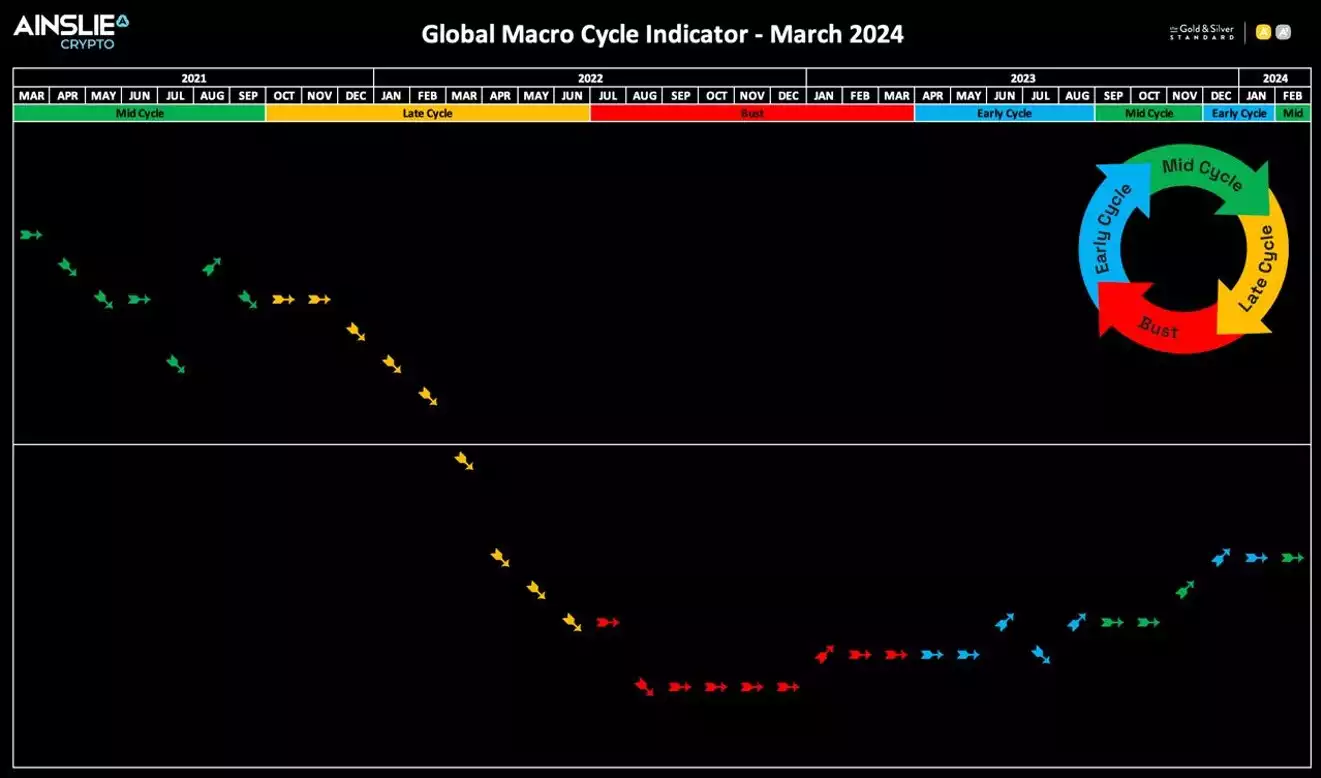
Where are we currently in the Global Macro Cycle?
We have transitioned back to the Mid Cycle phase of the Global Macro Cycle, and remain significantly below the halfway line. Mid Cycle is expected to continue well into late 2024.
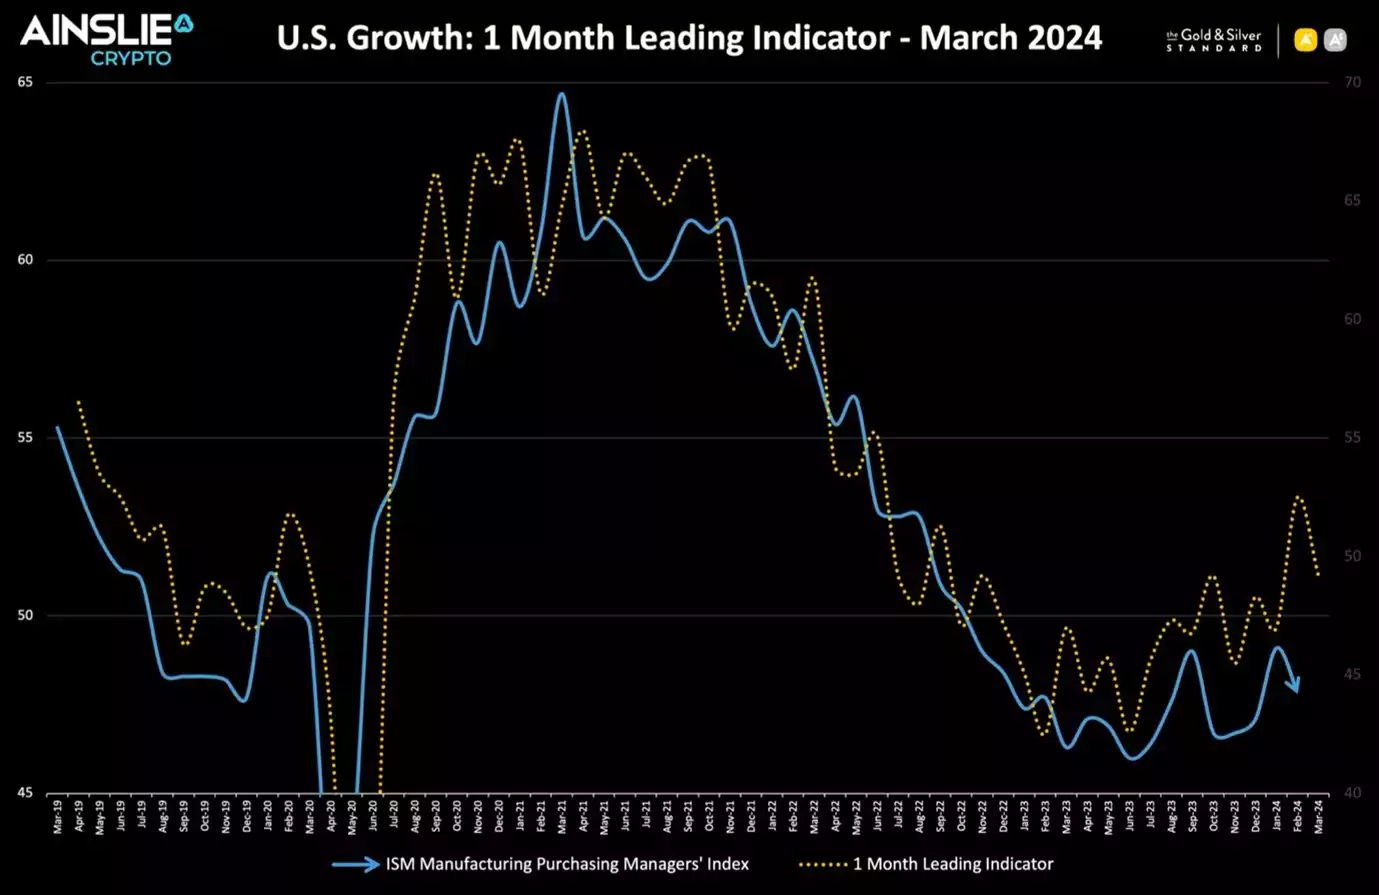
U.S. economic growth, as measured by the ISM data, is a useful tool to forecast the trajectory of the economy moving forward. After 17 months of contraction in the ISM, growth is expected to turn positive in the coming months. We believe the recession everyone is waiting for is behind us and the market bears are likely to remain wrongfooted in the medium term.
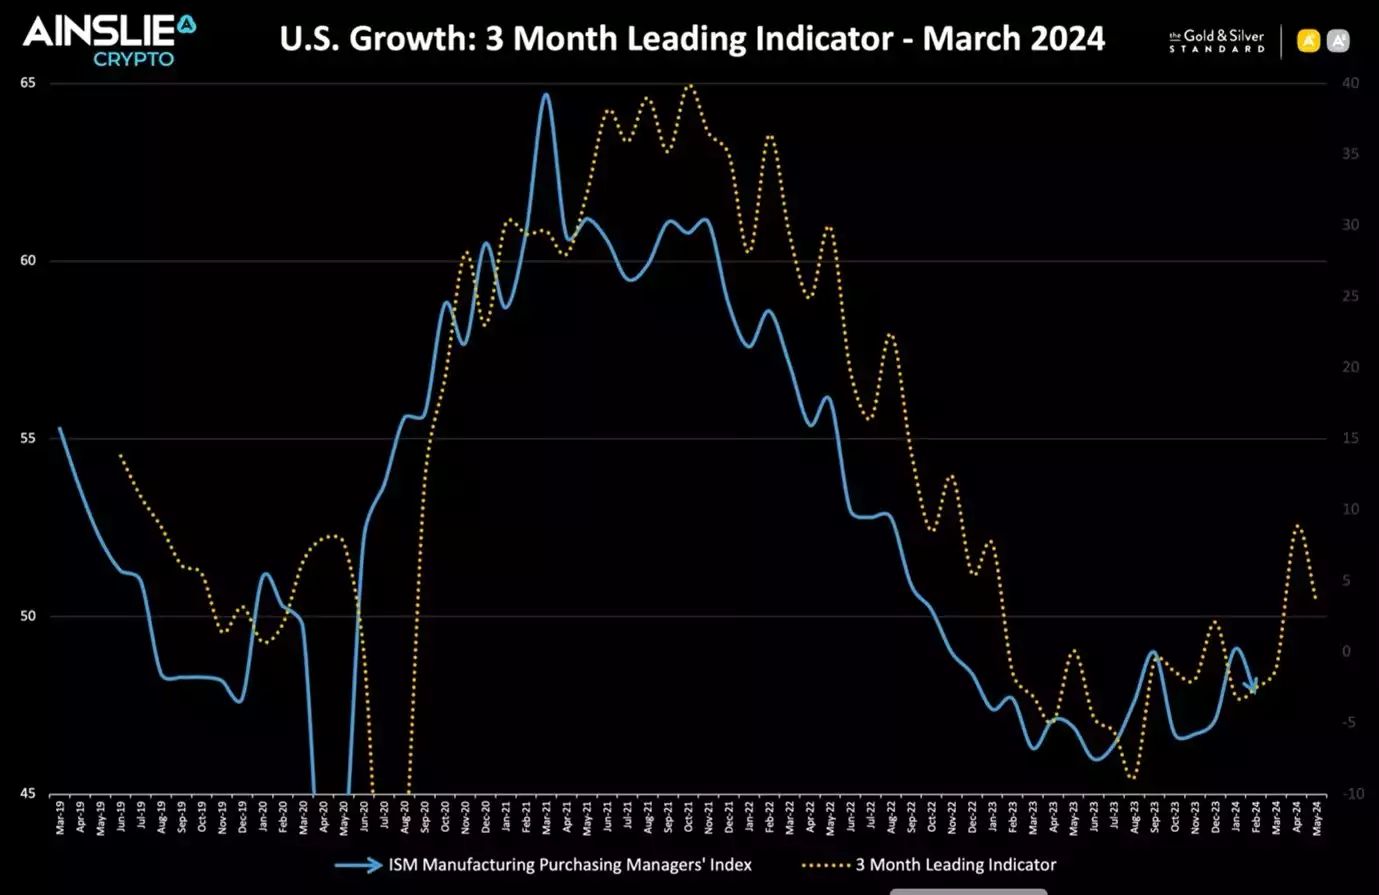
Also confirmed by our 3 month ISM leading indicator.
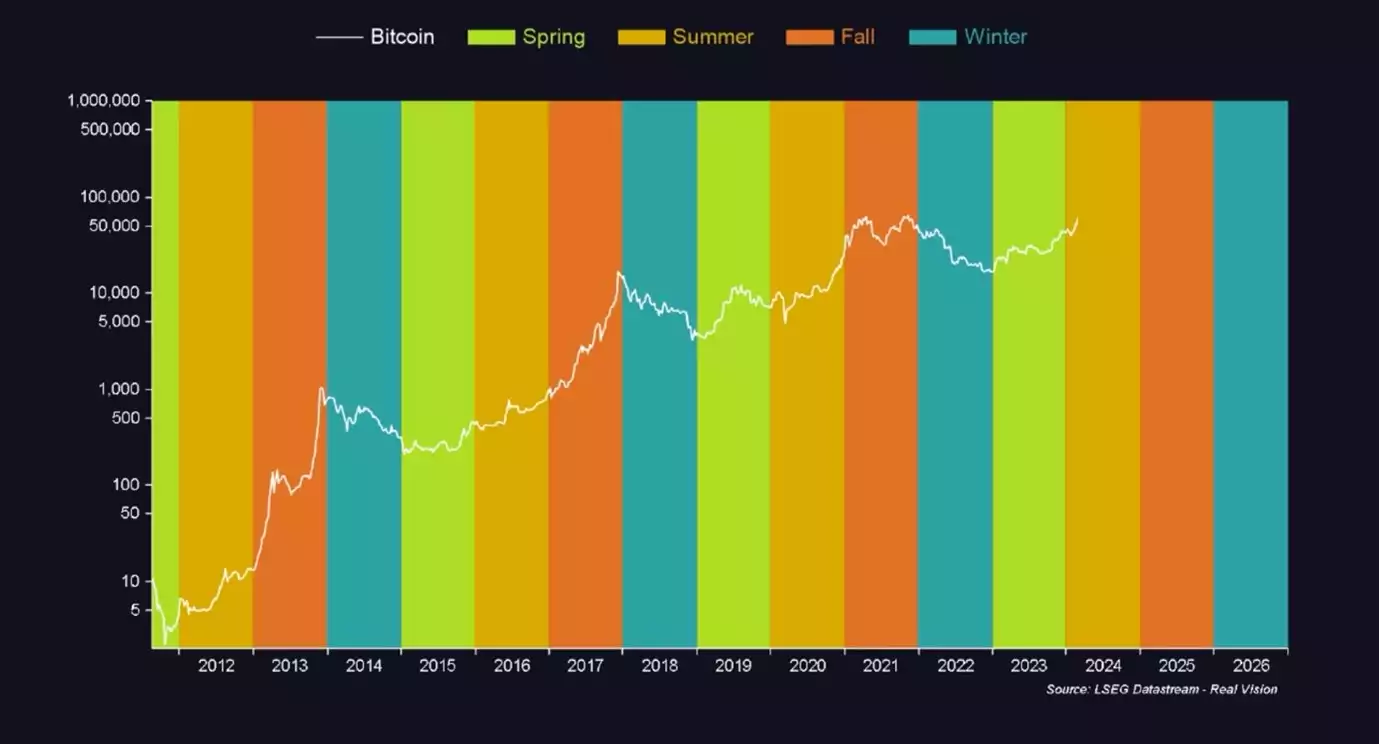
This aligns with our view that we are now moving into the summer portion of Bitcoin’s 4-year cycle. There will be drawdowns and periods of consolidation like we are currently experiencing. We see these corrections as healthy and historically the best way to trade them is to treat them as buying opportunities to benefit from Bitcoin’s seasonality.
Where are we currently in the Global Liquidity Cycle?
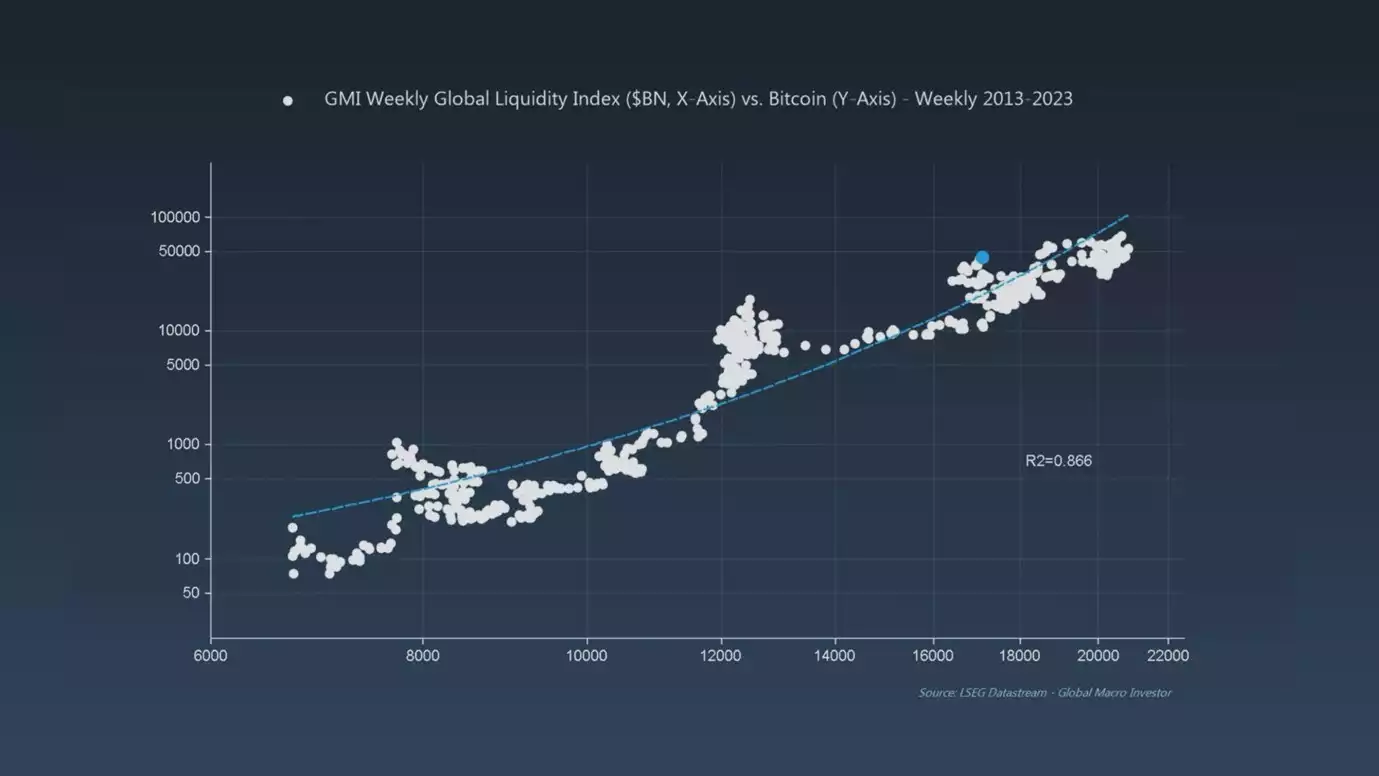
Global Liquidity leads the movement of World financial assets, so this is the indicator we look most closely at to determine where the opportunities are to take advantage of Bitcoin’s cycles. The dot plot below illustrates the tight correlation Bitcoin has with global liquidity.
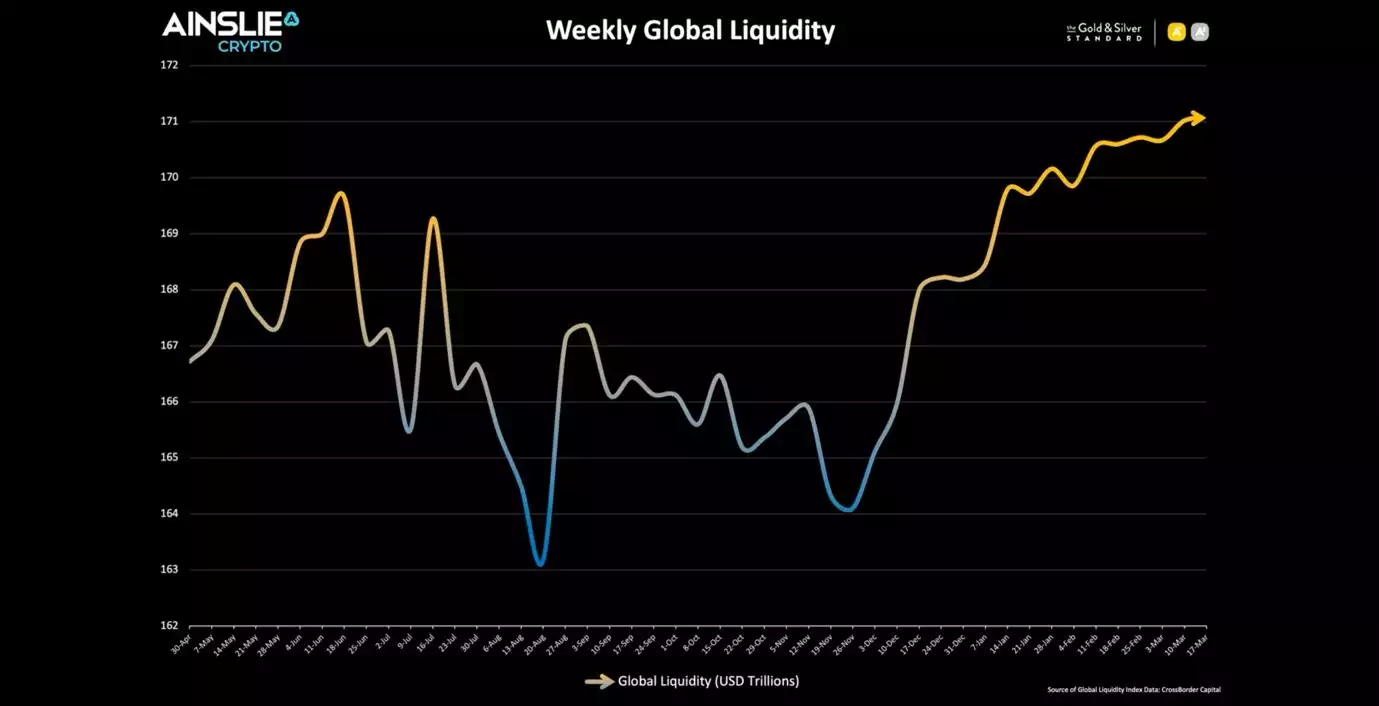
Global liquidity has reached a new nominal high at just over 170 trillion. There has been a slight contraction in the pace of the expansion over the past couple of weeks, however we expect this figure to continue to grow as the massive debt burden accumulated by governments continues to grow.
The Global Liquidity Index justifies the current drawdown and consolidation in Bitcoin with a dip back below 40. We don’t trade the liquidity pull back at this stage of the cycle, however, as it still has a long way to go.
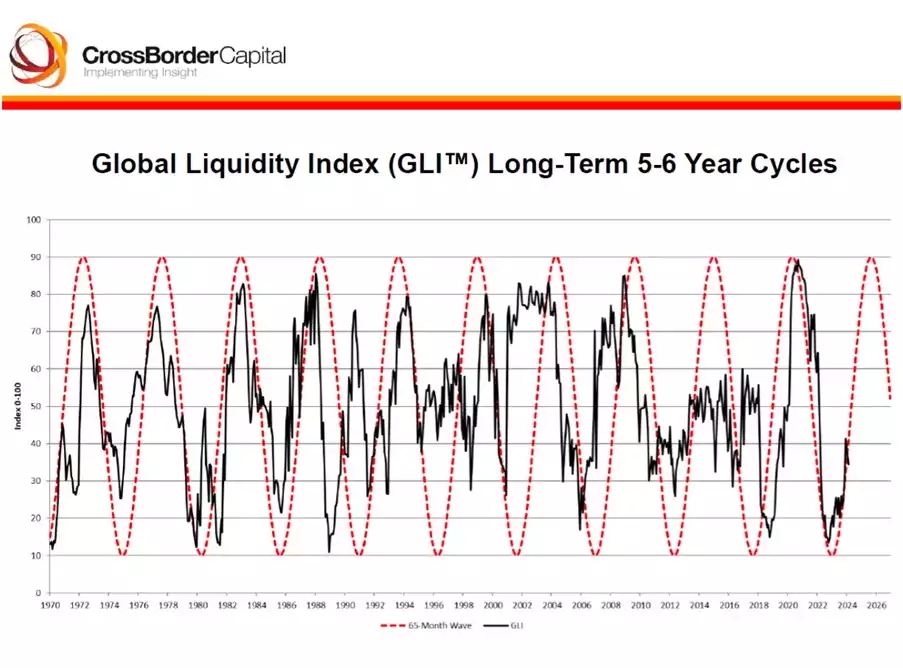
When looking at the Global Liquidity Index against Bitcoin historically, it still has enough runway to carry this cycle into 2025. The risk is not being in the market!
We anticipate central bank policy to continue to loosen throughout 2024 and into 2025, moving the heat map more into the green, and providing risk assets like Bitcoin with a tail wind.
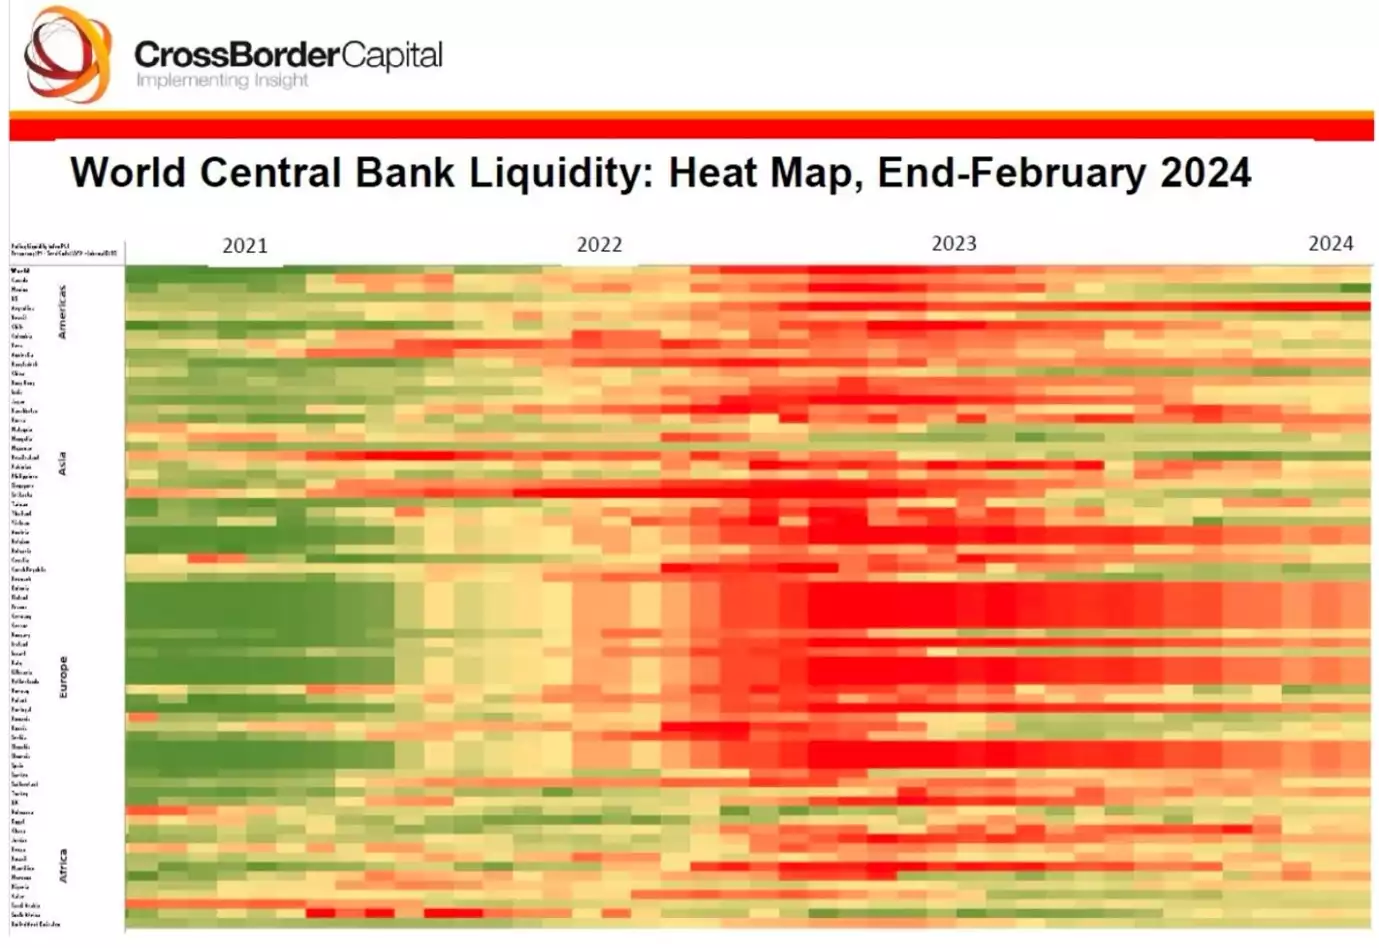
It is important to remember that while Consumer Price Inflation (CPI) has been heading lower over the past 24 months and now sits at 3.4%, assets like Bitcoin which have a high correlation to Global Liquidity, substantially outperform CPI and protect your purchasing power over long periods of time. It is up over 140% from just a year ago!
Bitcoin technical metrics
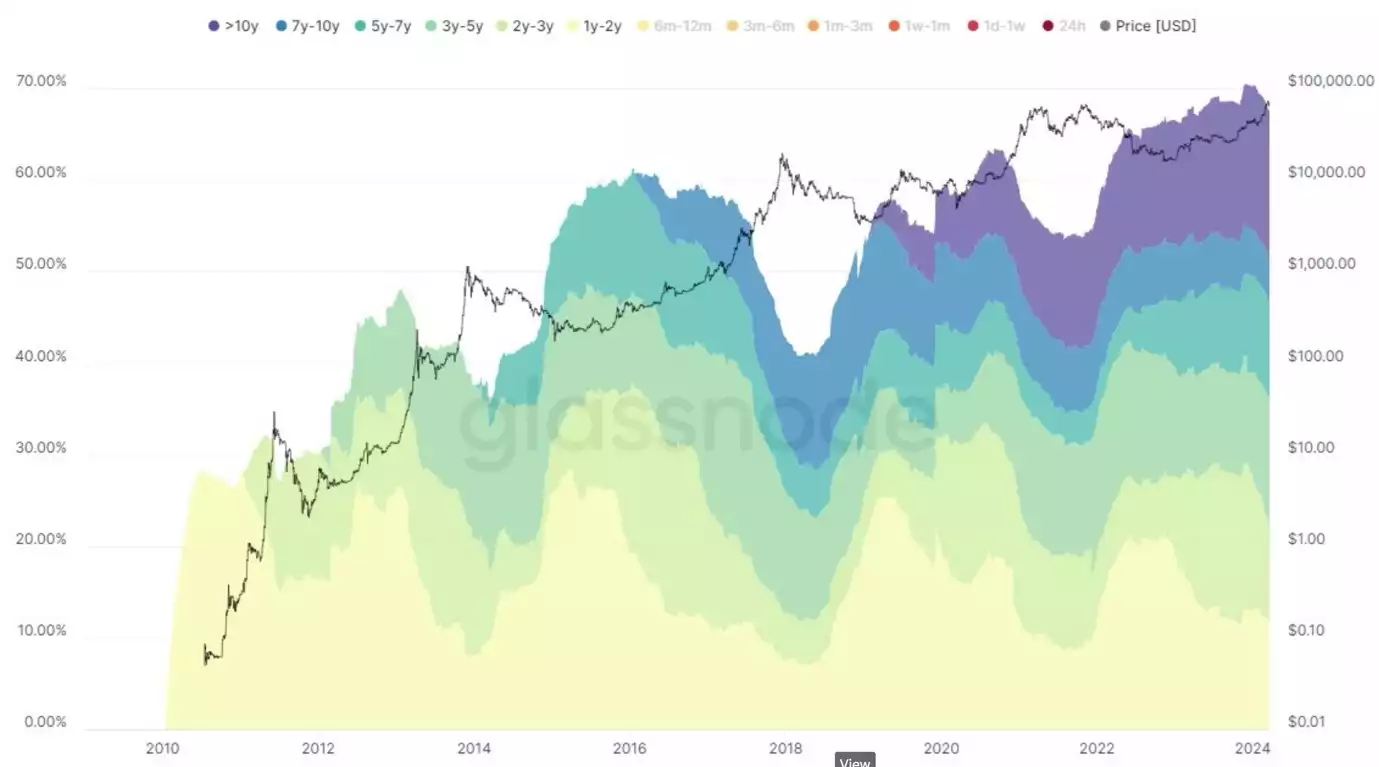
Long term holders (LTHs) have started to distribute to short term holders (STHs). LTHs are considered the smart money and have a low-cost basis per coin. They are happy to take profit around new all-time highs by selling their coins to STHs.
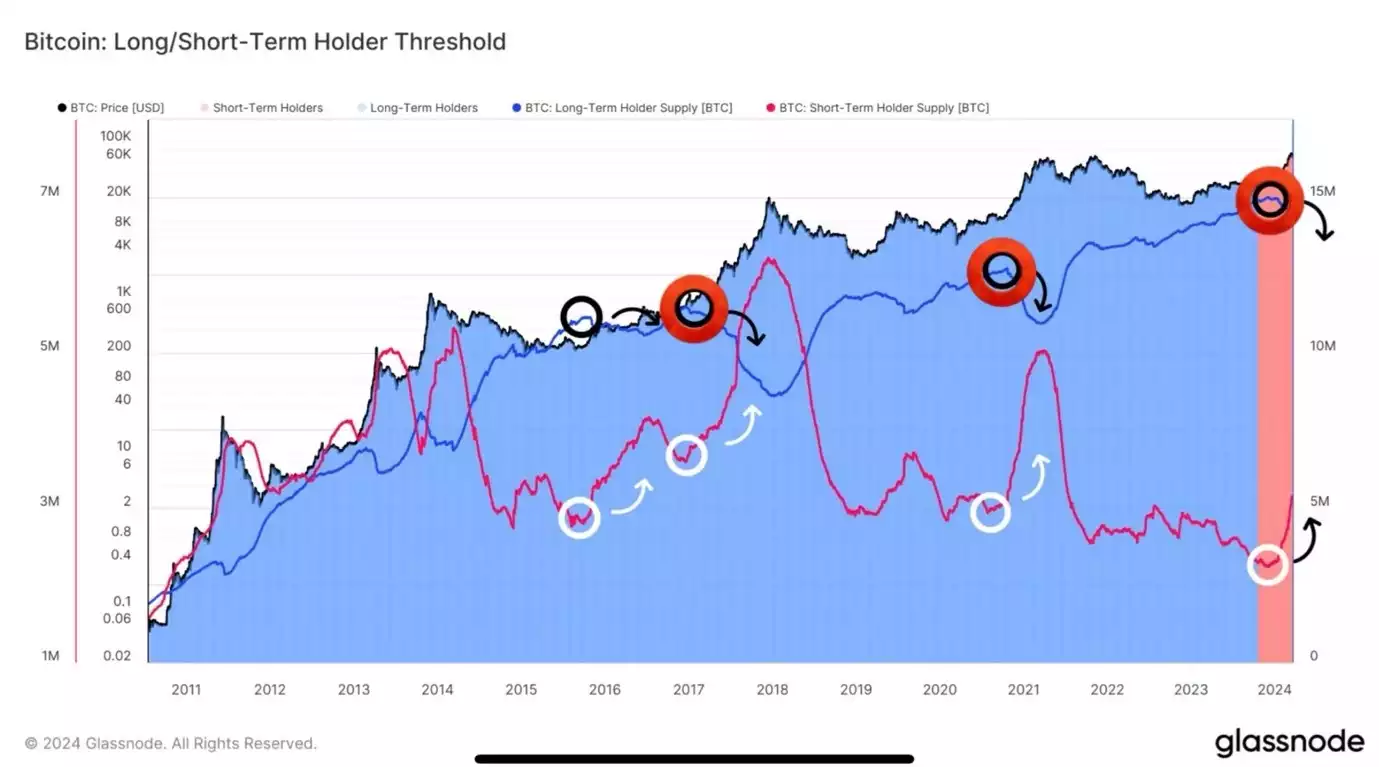
Even against the backdrop of this current selling, over 67% of coins still belong in the hands of LTHs, down from just over 70% at the start of the year. Long term holders continue to hold a larger percentage of coins through each cycle. While LTHs selling may seem bearish, it is a natural part of the Bitcoin cycle before the speculation phase starts and the biggest profits of the cycle are traditionally made.
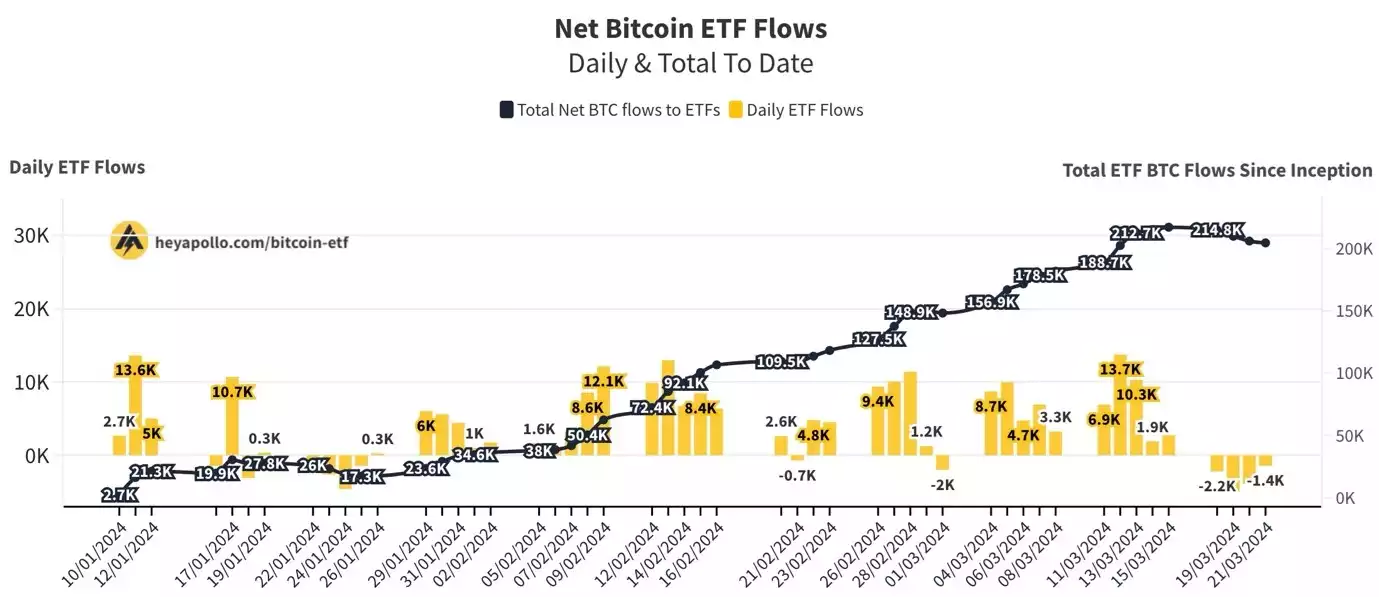
Those LTHs are selling directly into the BTC ETFs that launched on January 10. We consider ETF buyers to be ‘sticky’ and will themselves turn into LTHs when enough time has passed.
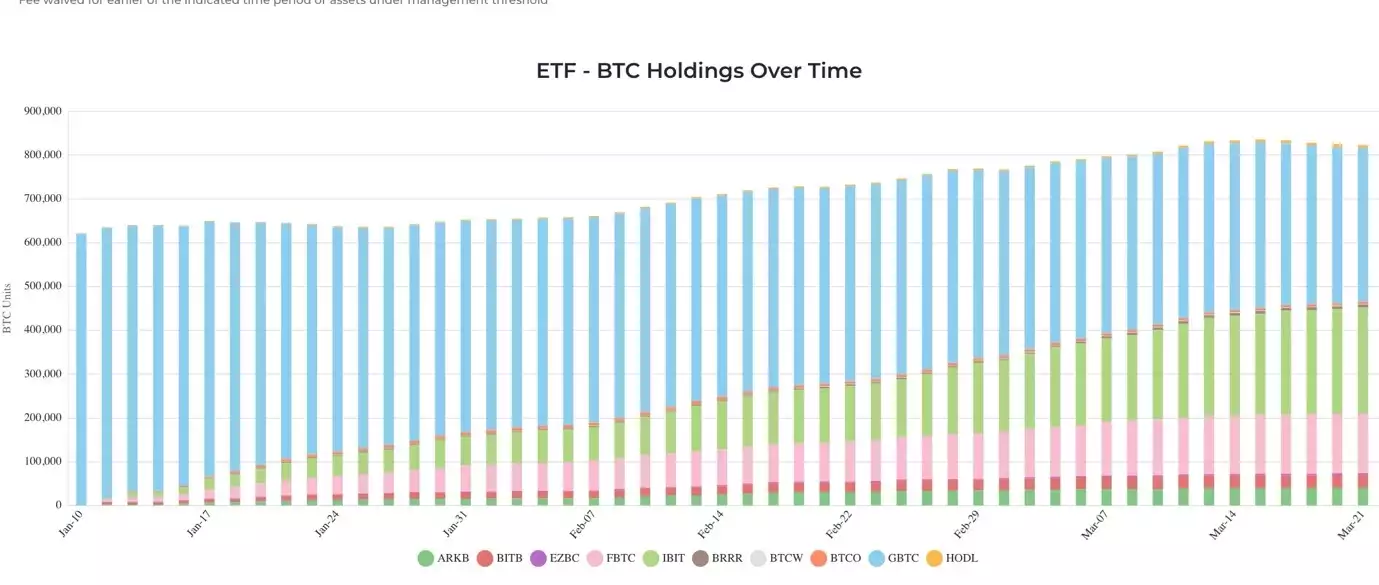
While there have been net outflows from the BTC ETFs over the past week, this is mostly due to forced liquidations to pay creditors of GBTC. We expect the GBTC outflows to slow significantly over the coming weeks with net inflows back into the ETFs.
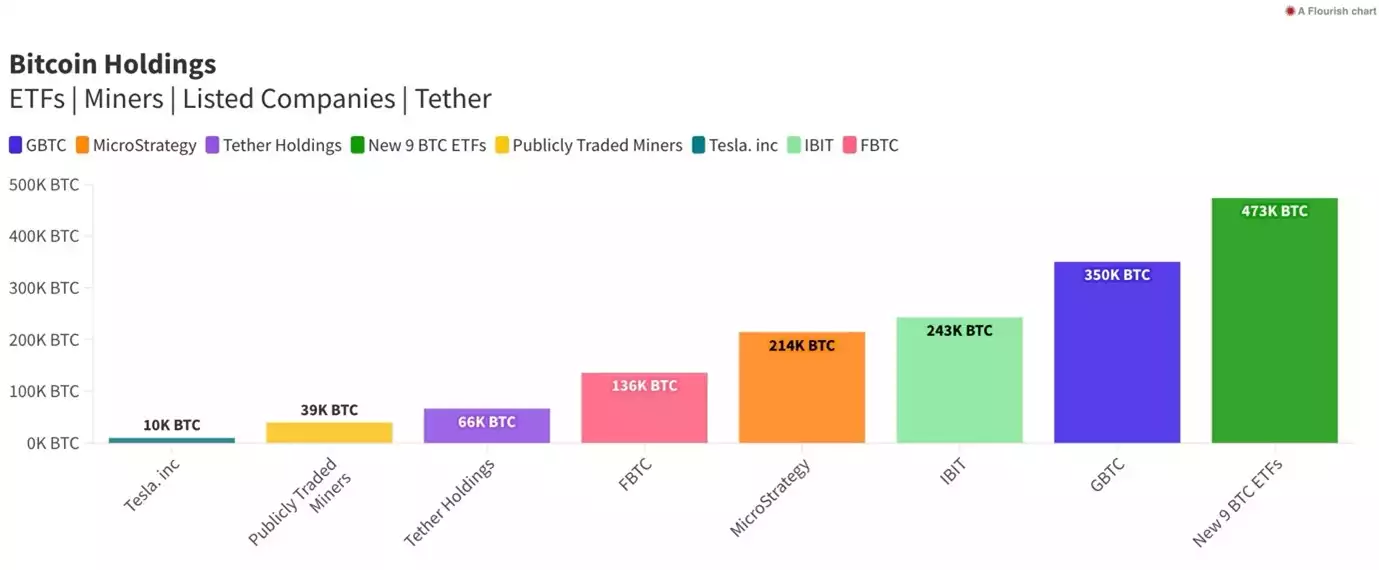
For reference, IBIT (BlackRock) now holds over 1.2% of the Bitcoin supply after launching their ETF just 2.5 months ago.
Conclusion
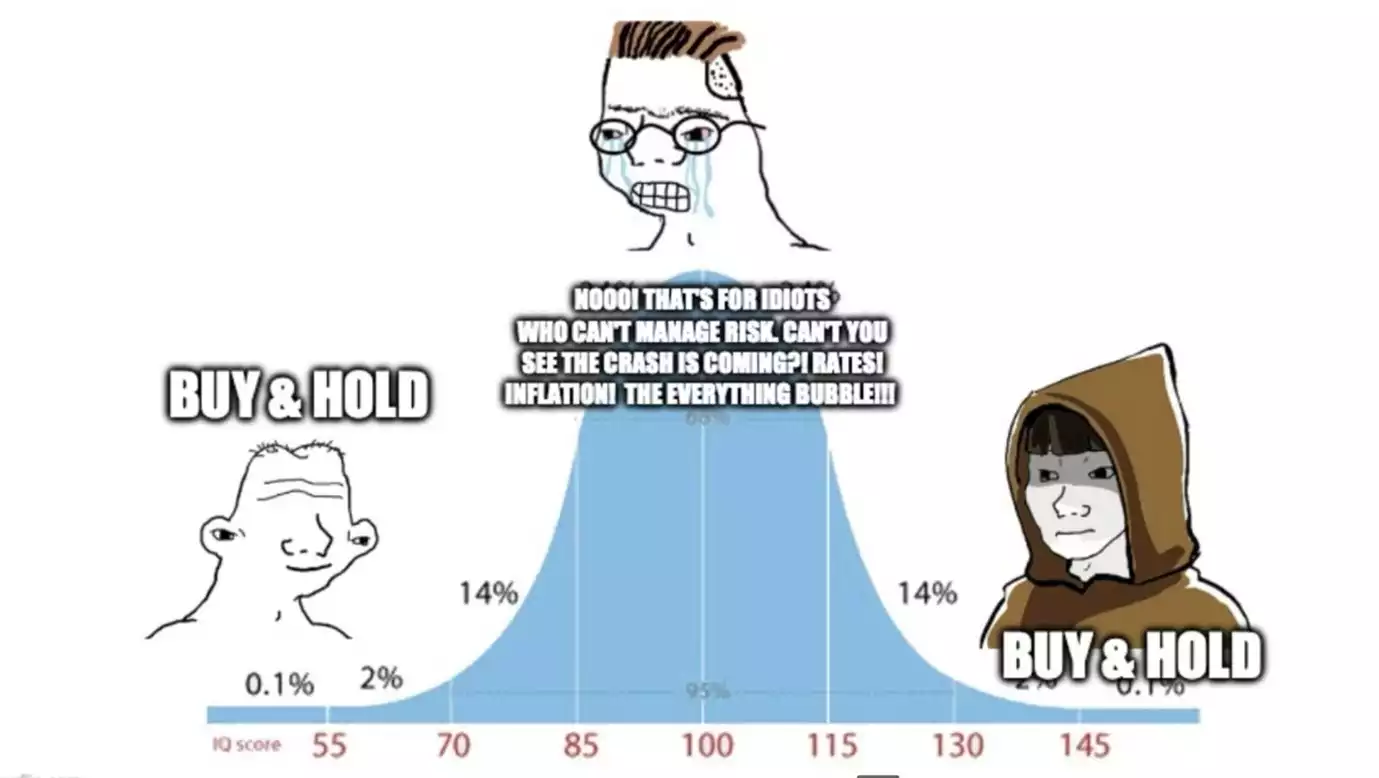
We believe we are now firmly in crypto summer. Price action won’t always be up and to the right… when it comes to Bitcoin it never is… but we do know the trends are in place and that we are likely to end up much higher than here. Avoid trading the volatility, add to the dips and ride the liquidity cycle - that’s how we make the most of the Bitcoin cycle. Don’t mid curve it!
Watch the full presentation with detailed explanations and discussion on our YouTube Channel here: https://youtu.be/CtV46YKeRqw
Until we return with more analysis next month, keep stacking those sats!
Joseph Brombal | Research and Analysis Manager
The Ainslie Group
x.com/Packin_Sats